
Well if you are a trader be it swing or positional you must have heard of a technical indicator named Ichimoku clouds but due to its complex structure you decided to stick with the technical indicators you are already familiar with. However, if you are unable to make profit consistently by using the indicators that you already know and you are seeking to improve your profitability, you have landed on the right page.
First thing first, how will a reasonably complex looking indicator with a difficult to pronounce name be able to improve your profitability when other relatively easy to understand indicators like Bollinger band, RSI, super trend etc. that you already know, have failed to do so?
Well there are several aspects to ichimoku cloud indicator that makes it outshine technical indicators. Let me elaborate them one by one:
Advantage of using Ichimoku Clouds
Ichimoku kinko hyo enables the trader to predict the future using one of its components called Cloud or Kumo which is drawn 26 trading days ahead of the current day which is absent in most of other indicators including 3 mentioned above.
Let me explain it with the help of a chart of Dow Jones Industrial Average on a daily timeframe. Clearly dow jones in is an uptrend and in such a condition whenever price falls it is likely to find support at upper boundary of the cloud. And this is exactly what has happened twice as shown using arrows in the chart:

- Once on the 29th of January 2021
- And second time on 4th of March 2021
Predict future price movements using Cloud
Now coming to the future part of the cloud which is drawn 26 days ahead of the current date. If we look at the shape, size and direction of the ichimoku cloud between 14th and 21st May 2021 it is thick and rising steeply. This gives us an indication that even if dow jones falls from here by 21th of May when cloud will rise steeply, price is likely to be above 33481.
So from current condition with the help of ichimoku indicator we are able to predict that as the market is in the uptrend in ideal scenario price will continue to rise but if price reverses due to any reason whatsoever it is still likely to stay above 33481 by 21st of May as indicated by arrow in the chart which explains why ichimoku cloud is better than other technical indicators.
Understand structure of the Cloud or Kumo
Here thickness of the cloud emphasis the fact that it is unlikely to be broken i.e. it is difficult for the price to break below lower boundary of the cloud even if upper boundary is broken. Such a future price prediction is not possible using most of the other indictors like Bollinger bands, super trend etc. which are visible only till current trading day and has nothing to give any insights about the future.
Apart from the cloud, Ichimoku indicator has other components as well like the conversion line (or tenkan sen), the base line (or kijun sen) and last but not the least the lagging span (or chikou span) as well as shown in Tesla chart below on a daily timeframe.
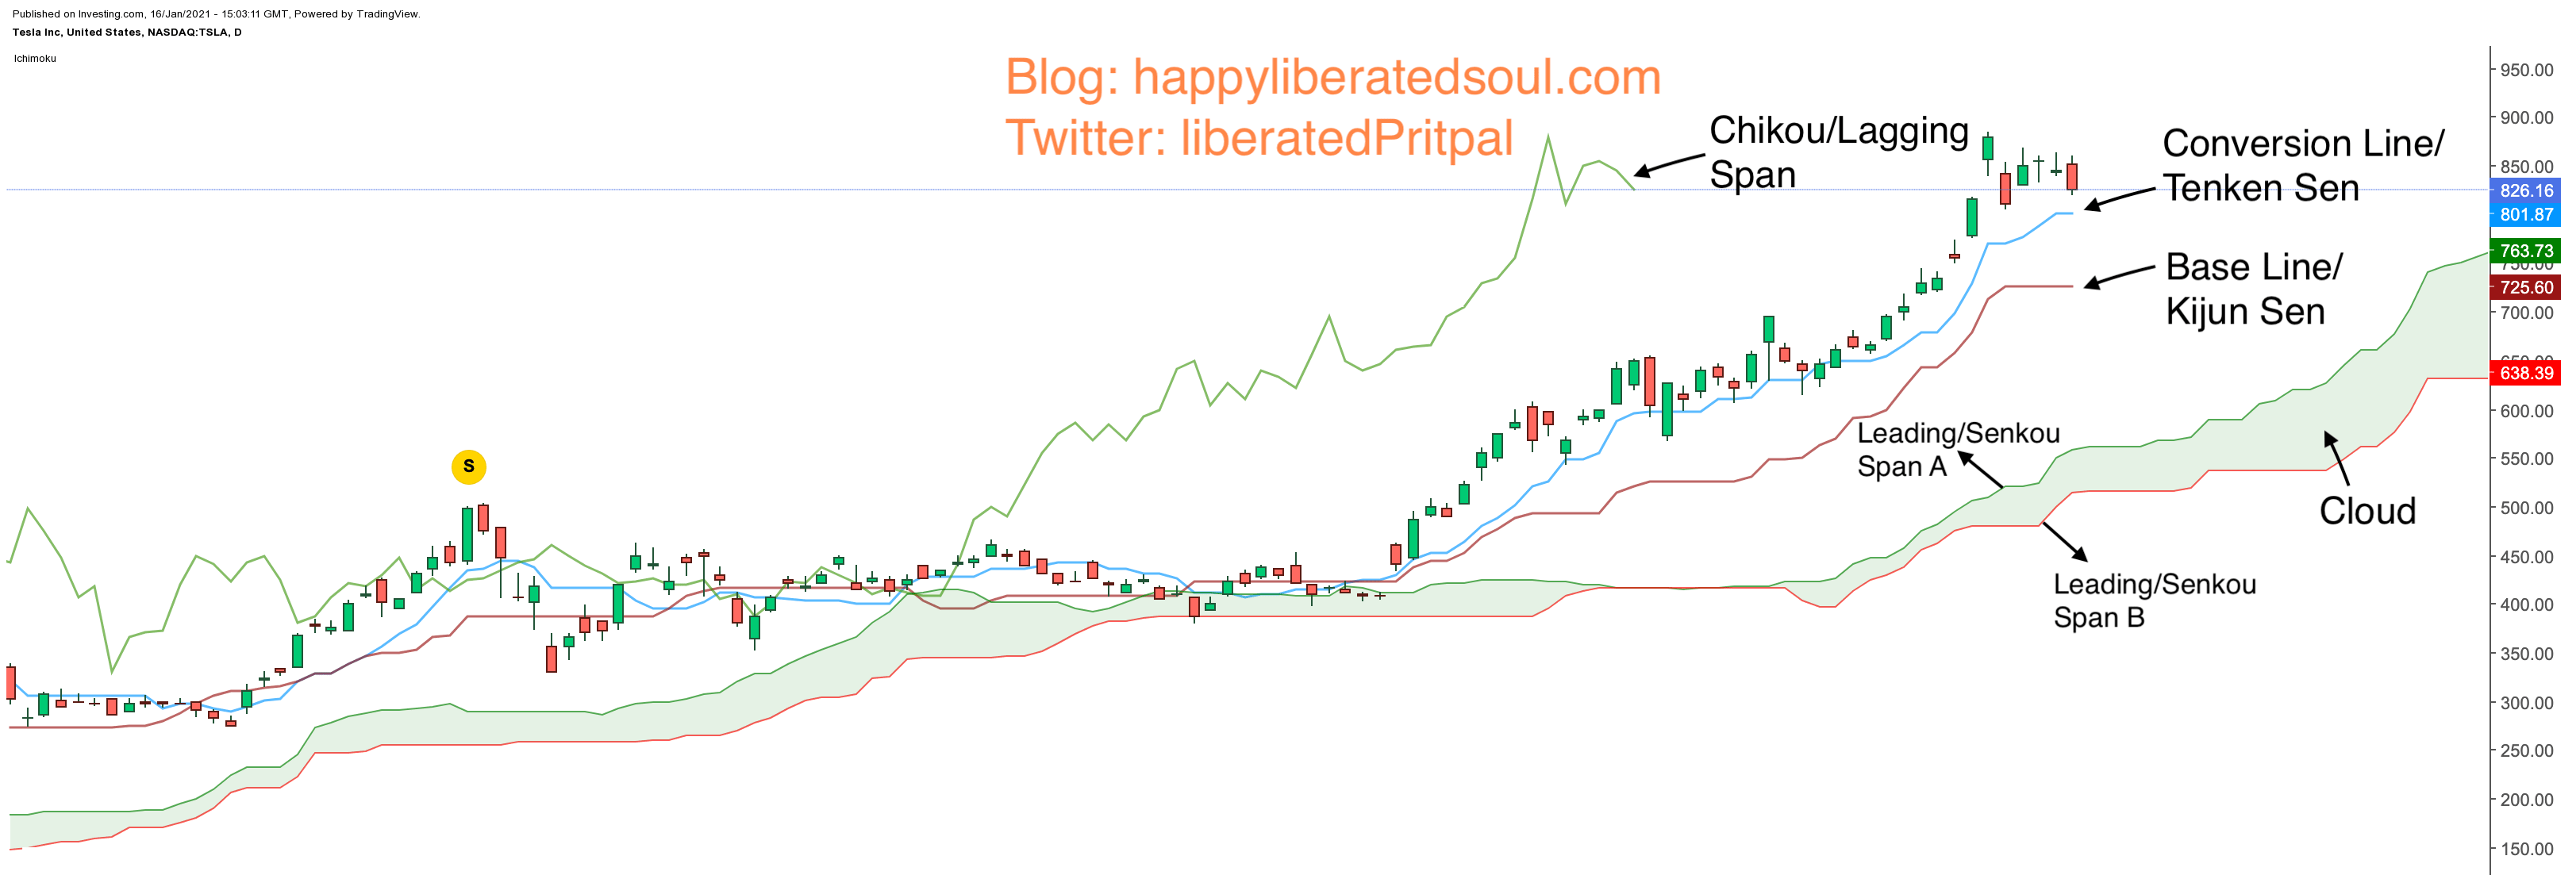
Each of the 5 components has a significant role to play in detecting ichmoku cloud signals and facilitating ichimoku trading strategies like moving average crossover and cloud breakout.
Bonus
Meanwhile you may also read my detailed tutorial on how to use ichimoku cloud by clicking here which explains each of the five components of ichimoku cloud from scratch with the help of charts along with key areas like:
Ichimoku cloud settings
Whats the best timeframe to use with Ichimoku clouds?
When does ichimoku signals works?
When ichimoku charts doesn’t works? and
Couple of ichimoku trading strategies
Conclusion
In a nutshell Ichimoku cloud gives you the edge (upper hand) in the trading world by helping you to predict possible future price with a help of a cloud drawn 26 candles ahead of current candle.
How are you using ichimoku trading system? Which timeframe suits you the most and are you able to get profitable trading signals using it? Do you agree with me on the reason I think why ichimoku cloud is better than other technical indicators. As always I would love to hear from you so do share how your experience has been with ichimoku trading in comments.

You have made some really good points there. I checked on the net for more information about the issue and found most individuals will go along with your views on this site.
Thanks Eli for you token of appreciation